Shifting to OSS Solutions from Proprietary Tools

Quick Summary
Datadog is a comprehensive monitoring and observability platform widely used for its out-of-the-box functionality and ease of use. However, as monitoring needs evolved and the use of custom metrics increased, a more cost-effective and customizable solution led us to migrate to Prometheus, an open source systems monitoring and alerting toolkit. In our client environment, we migrated from Datadog to Prometheus to reduce the monthly bill by approx 75%.
Customer Overview
The customer is a B2C e-commerce platform that enables sellers to design and sell custom merchandise, apparel, and digital products (referred to collectively as “Merchandise” or “products”). It also offers buyers the opportunity to discover and purchase high-quality, one-of-a-kind items. The company collaborates with popular creators like PewDiePie to offer exclusive merchandise to their global fans. 5.5 million creators utilize the client’s services to run their online stores.
Context and Challenges
Existing Setup
The client’s existing setup relied on Datadog for the observability needs, focusing on comprehensive metrics collection and analysis. The setup includes a range of features such as custom dashboards, alerts, and metrics tracking to ensure effective monitoring and quick response to potential issues.
Challenges:
High Custom Metrics costs
Datadog charges for each custom metric, and the costs can quickly shoot up out of control as the number of custom metrics increases. This is due to factors like high cardinality, where each metric is tagged by the host, leading to an explosion in the number of unique metrics.
The table illustrates the escalating costs of custom metrics in Datadog as the environment scales. Starting with 10 services, the monthly cost is $67.50 for 1,350 custom metrics. Increasing to 25 services raises the cost to $168.75 for 3,375 metrics. At 50 services, the cost surges to $39,062.50 due to 781,250 metrics, highlighting significant cost increases with more services and complex tag combinations.
Column A - Small env, 10 services, 5 custom metrics each service with 3 tags
Column B - Grows to a mid size env, 10 services, 5 custom metrics each service with 3 tags
Column C - Grows further, 50 services, 5 custom metrics but tags grows to 5 as well
The cost is calculated with the assumption that custom metrics cost $0.05 per metric.
| Scenario | Initial Setup (A) | Mid growth (B) | Growth Scenario (C) |
|---|---|---|---|
| Number of Services | 10 | 25 | 50 |
| Custom Metrics per Service | 5 | 5 | 5 |
| Number of Tags per Metric | 3 | 3 | 5 |
| Distinct Values per Tag | 3 | 3 | 5 |
| Tag Combinations per Metric | 27 (3 * 3 * 3) | 27 (3 * 3 * 3) | 3,125 (5 * 5 * 5 * 5 * 5) |
| Timeseries per Metric | 135 (5 * 27) | 135 (5 * 27) | 15625 (5 * 3,125) |
| Total Custom Metrics | 1,350 (10 * 135) | 3,375 (25 * 135) | 781,250 (50 * 15,625) |
| Monthly Cost | $67.50 (1,350 * $0.05) | $168.75 (3,375 * $0.05) | $39,062.50 (781,250 * $0.05) |
In this case where we did migrate for an enterprise client, the number of custom metrics were around 1 million.
Existing cost of Datadog - $40000 per month
Vendor lock-in
Datadog’s custom metrics are proprietary and can only be reported to the Datadog agent, making it difficult to migrate away from Datadog in the long run. This vendor lock-in allows Datadog to potentially raise prices over time.
Difficult to manage high cardinal Data
Microservices usage scales with the organization, and managing the high cardinal data (metrics tagged by hosts, services, etc) becomes very difficult with Datadog. Cardinality refers to unique combinations of metrics labels, and high cardinality means many unique values. Datadog uses a tagging mechanism where metrics can be tagged using multiple dimensions such as host, service, region, etc. As the number of tags increases, their combinations tend to explode with time, which leads to high cardinality. This can lead to querying complexity or lack of visibility into what data is being collected and what is being actually used. On the other hand, Prometheus optimizes data by storing it locally and using an efficient indexing mechanism, which leads to low latency in querying data.
Solutions Deployed
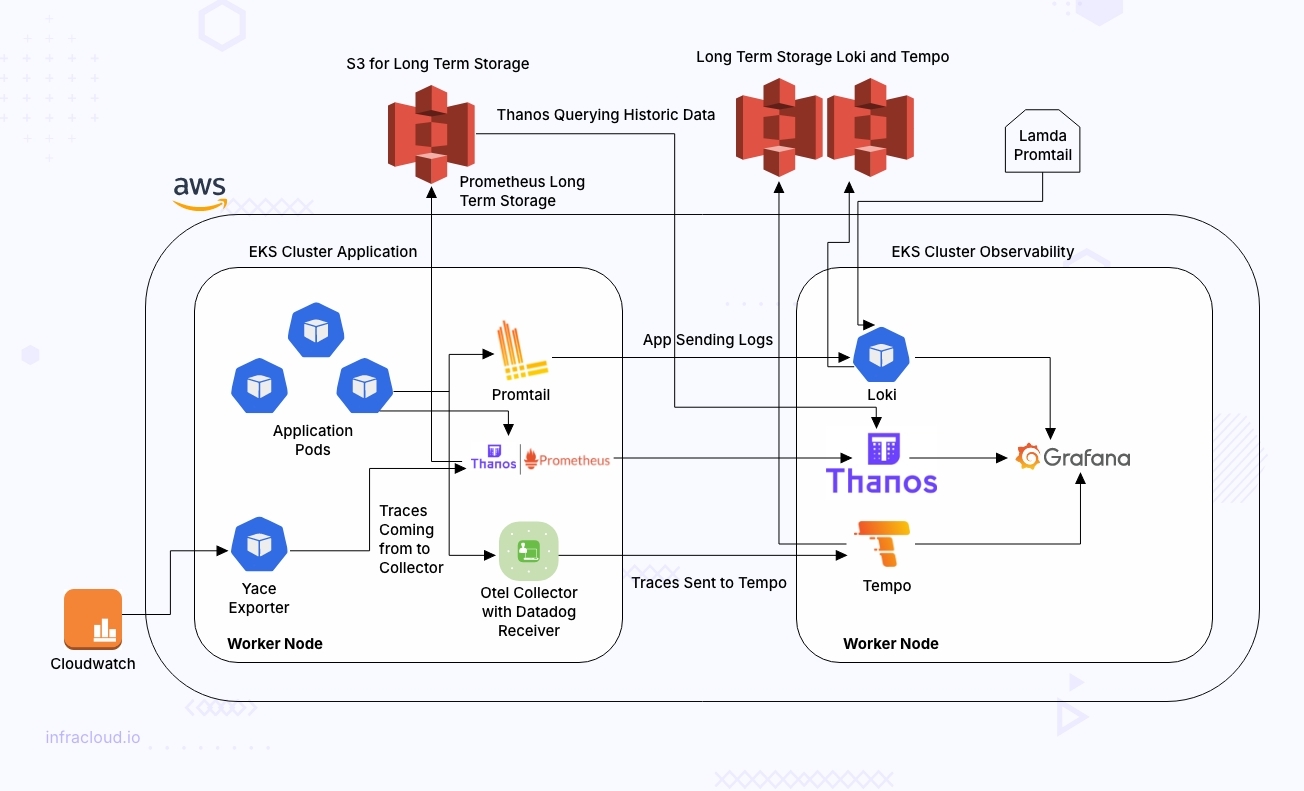
To address these challenges, we deployed a comprehensive solution leveraging several open source tools and cloud services that are integrated to work seamlessly across all EKS clusters.

Centralized monitoring with Thanos and Prometheus
- Prometheus: Deployed in each EKS cluster to collect and store metrics locally. Prometheus is renowned for its robust metrics collection and alerting capabilities.
- Thanos: Implemented for centralized monitoring data aggregation. Thanos extends Prometheus by enabling highly available (HA) and long-term storage of monitoring data across multiple clusters. It aggregates metrics from all Prometheus instances, providing a single pane of glass for monitoring.
Centralized logging with Loki and Promtail
- Promtail: Installed in each EKS cluster to collect logs and forward them to a central Loki instance. Promtail acts as an agent that scrapes logs from Kubernetes pods.
- Loki: Deployed centrally to store and index logs. Loki is designed to work seamlessly with Grafana, making it easier to correlate logs with metrics.
Centralized tracing with OpenTelemetry, Datadog, and Tempo
- OpenTelemetry Collector: Used to collect traces from applications. As many of our applications were already instrumented with the Datadog SDK, we configured the OpenTelemetry Collector with a Datadog receiver (open source).
- Datadog receiver: Datadog receiver is an open source tool and can collect data in Datadog format and convert it into OpenTelemetry format. This saved developers’ efforts to change the code to use Open Telemetry SDK instead of Datadog SDK.
- Tempo: Implemented for centralized trace storage and analysis. Tempo is an open source distributed tracing backend that integrates well with Grafana, enabling us to visualize traces alongside metrics and logs.
Visualization and user experience with Grafana
- Grafana: Used as the primary visualization tool. Grafana was chosen for its powerful dashboarding capabilities and ease of integration with Prometheus, Loki, and Tempo.
- Client SSO Integration: Integrated client’s Single Sign-On (SSO) tools with Grafana to provide a seamless user experience for developers. This mirrored the SSO integration we had with Datadog, ensuring consistent access management.
Cost for new stack
The total monthly cost for the new stack deployment was approximately $10,000. he new stack developed using Prometheus and OSS achieved the same performance at nearly 75% less cost compared to Datadog.
Benefits
- Cost savings: Cost saving of approx $30000 per month.
- Consistent user experience: IIntegrating SSO with Grafana and maintaining familiar dashboards and alerts minimized disruption for our development and operations teams.
Trade-Offs
- Increased maintenance overhead: Additional effort required for managing and maintaining the Prometheus infrastructure.
- Loss of historical data: Historical data was not migrated because Datadog’s custom metrics can only be reported to the Datadog dashboard. Moving away from it resulted in a loss of past metrics and insights.
Why InfraCloud?
- Expertise in complexity: At InfraCloud, we excel at solving intricate challenges for our clients using various cutting-edge tools and technologies. Our long history in programmable infrastructure space, from VMs to containers, gives us an edge. Our DevOps engineers have pioneered DevOps at Fortune 500 companies.
- Open source commitment: Our dedication to open source contributions sharpens our skills and offers us unique insights into maximizing technology potential.
- Migration specialists: We are experts in smooth migrations, helping clients migrate from proprietary to OSS and vice versa, on-premise to cloud & multi-cloud setups, monolithic to microservices, etc.
- Supportive team: Our experienced team will support you at every step of your cloud migration journey! We will assess your requirements, help you with planning and execution, and provide post-migration support to ensure everything runs smoothly.
Got a Question or Need Expert Advise?
Schedule a 30 mins chat with our experts to discuss more.


