Distributed Tracing in Grafana with Tempo and Jaeger

Why do I need tracing if I have a good logging and monitoring framework?
Application logs are beneficial for displaying important events if something is not working as expected (failure, error, incorrect config, etc.). Although it is a very crucial element in application design, one should log thriftily. This is because log collection, transformation, and storage are costly.
Unlike logging, which is event triggered and discrete, tracing provides a broader and continuous application view. Tracing helps us understand the path of a process/transaction/entity while traversing the application stack and identifying the bottlenecks at various stages. This helps to optimize the application and increase performance.
In this post, we will see how to introduce tracing in logs and visualize it easily with Grafana Tempo and Jaeger. In this example, we will use Prometheus, Grafana Loki, Jaeger, and Grafana Tempo as datasources for monitoring metrics, logs, and traces respectively in Grafana.
What is distributed-tracing?
In a microservices architecture, understanding an application behavior can be an intriguing task. This is because the incoming requests may span over multiple services, and each intermittent service may have one or more operations on that request. Resulting in increased complexity and takes more time while troubleshooting problems.
Distributed tracing helps to get insight into the individual operation and pinpoint the areas of failure caused by poor performance.
What is OpenTracing?
OpenTracing comprises an API specification, frameworks, and libraries to enable distributed tracing in any application. OpenTracing APIs are very generic and prevents vendor/product lock-in. Recently, OpenTracing and OpenCensus merged to form OpenTelemetry (acronym OTel). It targets the creation and management of telemetry data such as traces, metrics, and logs through a set of APIs, SDKs, tooling, and integrations. Note: OpenCensus consists of a set of libs for various languages to collect metrics and traces from Applications, visualize them locally and send them remotely for storage and analysis.
What are the fundamental elements of OpenTracing?
Span: It is a primary building block of a distributed trace. It comprises a name, start time, and duration.
Trace: It is a visualization of a request/transaction as it traverses through a distributed system.
Tags: It is key-value information for identifying a span. It helps to query, filter and analyze trace data.
Logs: Logs are key-value pairs that are useful for capturing span-specific logging messages and other debugging or informational output from the application itself.
Span-context: It is a process of association of certain data with the incoming request. This context is accessible in all other layers of the application within the same process.
What available tools are compatible with OpenTracing?
Zipkin: It was one of the first distributed-tracing tools developed by Twitter, inspired by Google Dapper paper. Zipkin is coded in Java and supports Cassandra and ElasticSearch for backend scalability.
It comprises clients or reporters to gather trace data, collectors to index and store the data, a query service to extract and retrieve the trace data, and UI to visualize the traces. Zipkin is compatible with the OpenTracing standard, so these implementations should also work with other distributed tracing systems.
Jaeger: Jaeger is another OpenTracing compatible project from Uber Technologies written in Go. Jaeger also supports Cassandra and ElasticSearch as scalable backend solutions. Although its architecture is like Zipkin, it comprises an additional agent on each host to aggregate data in batches before sending it to the collector.
Appdash: Appdash, created by Sourcegraph, is another distributed tracing system written in Go. It also supports the OpenTracing standard.
Grafana Tempo: Tempo is an open source, highly scalable distributed tracing backend option. We can easily integrate it with Grafana, Loki, and Prometheus. It only requires object storage and is compatible with other open tracing protocols like Jaeger, Zipkin, and OpenTelemetry.
Enabling and visualizing traces with Grafana Tempo
There are many hands-on tutorials/demos available, but they exist for the docker-compose environment. In this post, We will run a tracing example in a Kubernetes environment. We will take the classic example provided by Jaeger, i.e., HOTROD. Although Jaeger has its own UI to visualize traces, we will visualize it in Grafana with Jaeger as a data source. Similarly, we will also see how Grafana Tempo is useful for visualizing the traces.
For getting started with enabling and visualizing traces, we will clone the Jaeger GitHub repo:
git clone https://github.com/jaegertracing/jaeger.git
Enable distributed tracing in microservice application
You can check how to enable OpenTracing by navigating through the repo as shown below.
cd jaeger/examples/hotrod
cat pkg/log/factory.go
if span := opentracing.SpanFromContext(ctx); span != nil {
		logger := spanLogger{span: span, logger: b.logger}

		if jaegerCtx, ok := span.Context().(jaeger.SpanContext); ok {
			logger.spanFields = []zapcore.Field{
				zap.String("trace_id", jaegerCtx.TraceID().String()),
				zap.String("span_id", jaegerCtx.SpanID().String()),
			}
		}
Convert docker-compose manifest to Kubernetes manifest
In the hotrod directory, check the existing Docker manifests.
You will see the docker-compose.yml file deploying services like Jaeger and HOTROD. We will use kompose to convert docker-compose manifest to Kubernetes manifest.
kompose convert
You will see some files being created. We are specifically interested in hotrod-deployment.yaml, hotrod-service.yaml, jaeger-deployment.yaml, and jaeger-service.yaml. For simplicity, we will add the following label in the hotrod-deployment manifest.
metadata:
  annotations:
    kompose.cmd: kompose convert
    kompose.version: 1.21.0 (992df58d8)
  creationTimestamp: null
  labels:
    app: hotrod
  name: hotrod
spec:
  replicas: 1
  selector:
    matchLabels:
      app: hotrod
Enable Jaeger tracing in deployment manifest
Now we need to add the following environment variables in hotrod-deployment.yaml.
spec:
  containers:
  - args:
    - all
    env:
    - name: JAEGER_AGENT_HOST
      value: tempo
    - name: JAEGER_AGENT_PORT
      value: "6831"
    - name: JAEGER_SAMPLER_TYPE
      value: const
    - name: JAEGER_SAMPLER_PARAM
      value: "1"
    - name: JAEGER_TAGS
      value: app=hotrod
    image: jaegertracing/example-hotrod:latest
    imagePullPolicy: ""
    name: hotrod
    ports:
    - containerPort: 8080
    resources: {}
JAEGER_AGENT_HOST: It is a hostname to communicate with an agent (defaults to localhost).
JAEGER_AGENT_PORT: It is a port to communicate with an agent (defaults to 6831).
JAEGER_SAMPLER_TYPE: Four types are available remote, const, probabilistic, ratelimiting (defaults to remote). For example, const type refers to sampling decision for every trace.
JAEGER_SAMPLER_PARAM: It is a value between 0 to 1 (1 for sampling every trace and 0 for sampling none of them).
JAEGER_TAGS: It is a comma-separated list of name=value tracer-level tags, which get added to all reported spans.
Now we will apply these manifests. Note that this will require a running Kubernetes cluster as a pre-requisite.
Install Prometheus and Loki
Next, we install Prometheus, Loki, and Grafana. The Prometheus Operator Helm chart (kube-prometheus-stack) will install Prometheus and Grafana. Loki Helm chart (loki-stack) will install Loki and Promtail. I have written another post which talks more on log monitoring with Loki.
helm upgrade --install prometheus prometheus-community/kube-prometheus-stack
helm upgrade --install loki grafana/loki-stack
We need to add Jaeger and Loki data-sources in Grafana. You can achieve this by either manually adding it or having it in the code. We will have the latter one by creating a custom values file prom-oper-values.yaml as shown below.
grafana:
  additionalDataSources:
    - name: loki
      type: loki
      uid: my-loki
      access: proxy
      orgId: 1
      url: http://loki:3100
      basicAuth: false
      isDefault: false
      version: 1
      editable: true
    - name: jaeger
      type: jaeger
      uid: my-jaeger
      access: browser
      url: http://jaeger:16686
      isDefault: false
      version: 1
      editable: true
      basicAuth: false
uid: It is a unique user-defined id.
access: It states whether the access is proxy or direct (server or browser).
isDefault: It sets a data-source to default.
version: It helps in the versioning of the config file.
editable: It allows to update datasource from UI.
We will now upgrade the kube-prometheus-stack Helm chart with the custom values.
helm upgrade --install prometheus prometheus-community/kube-prometheus-stack --values=prom-oper-values.yaml
If you go to the data-sources, you can see jaeger and loki added here. It’s time to see how traces are being logged in the log message. For this, we will go to the HOTROD UI and trigger the request from there.
Note: In our configuration, we have given the name loki and jaeger for the Loki and Jaeger data-sources respectively.

Note: Grafana and HOTROD services are using ClusterIP we will use port-forwarding to access the UI.
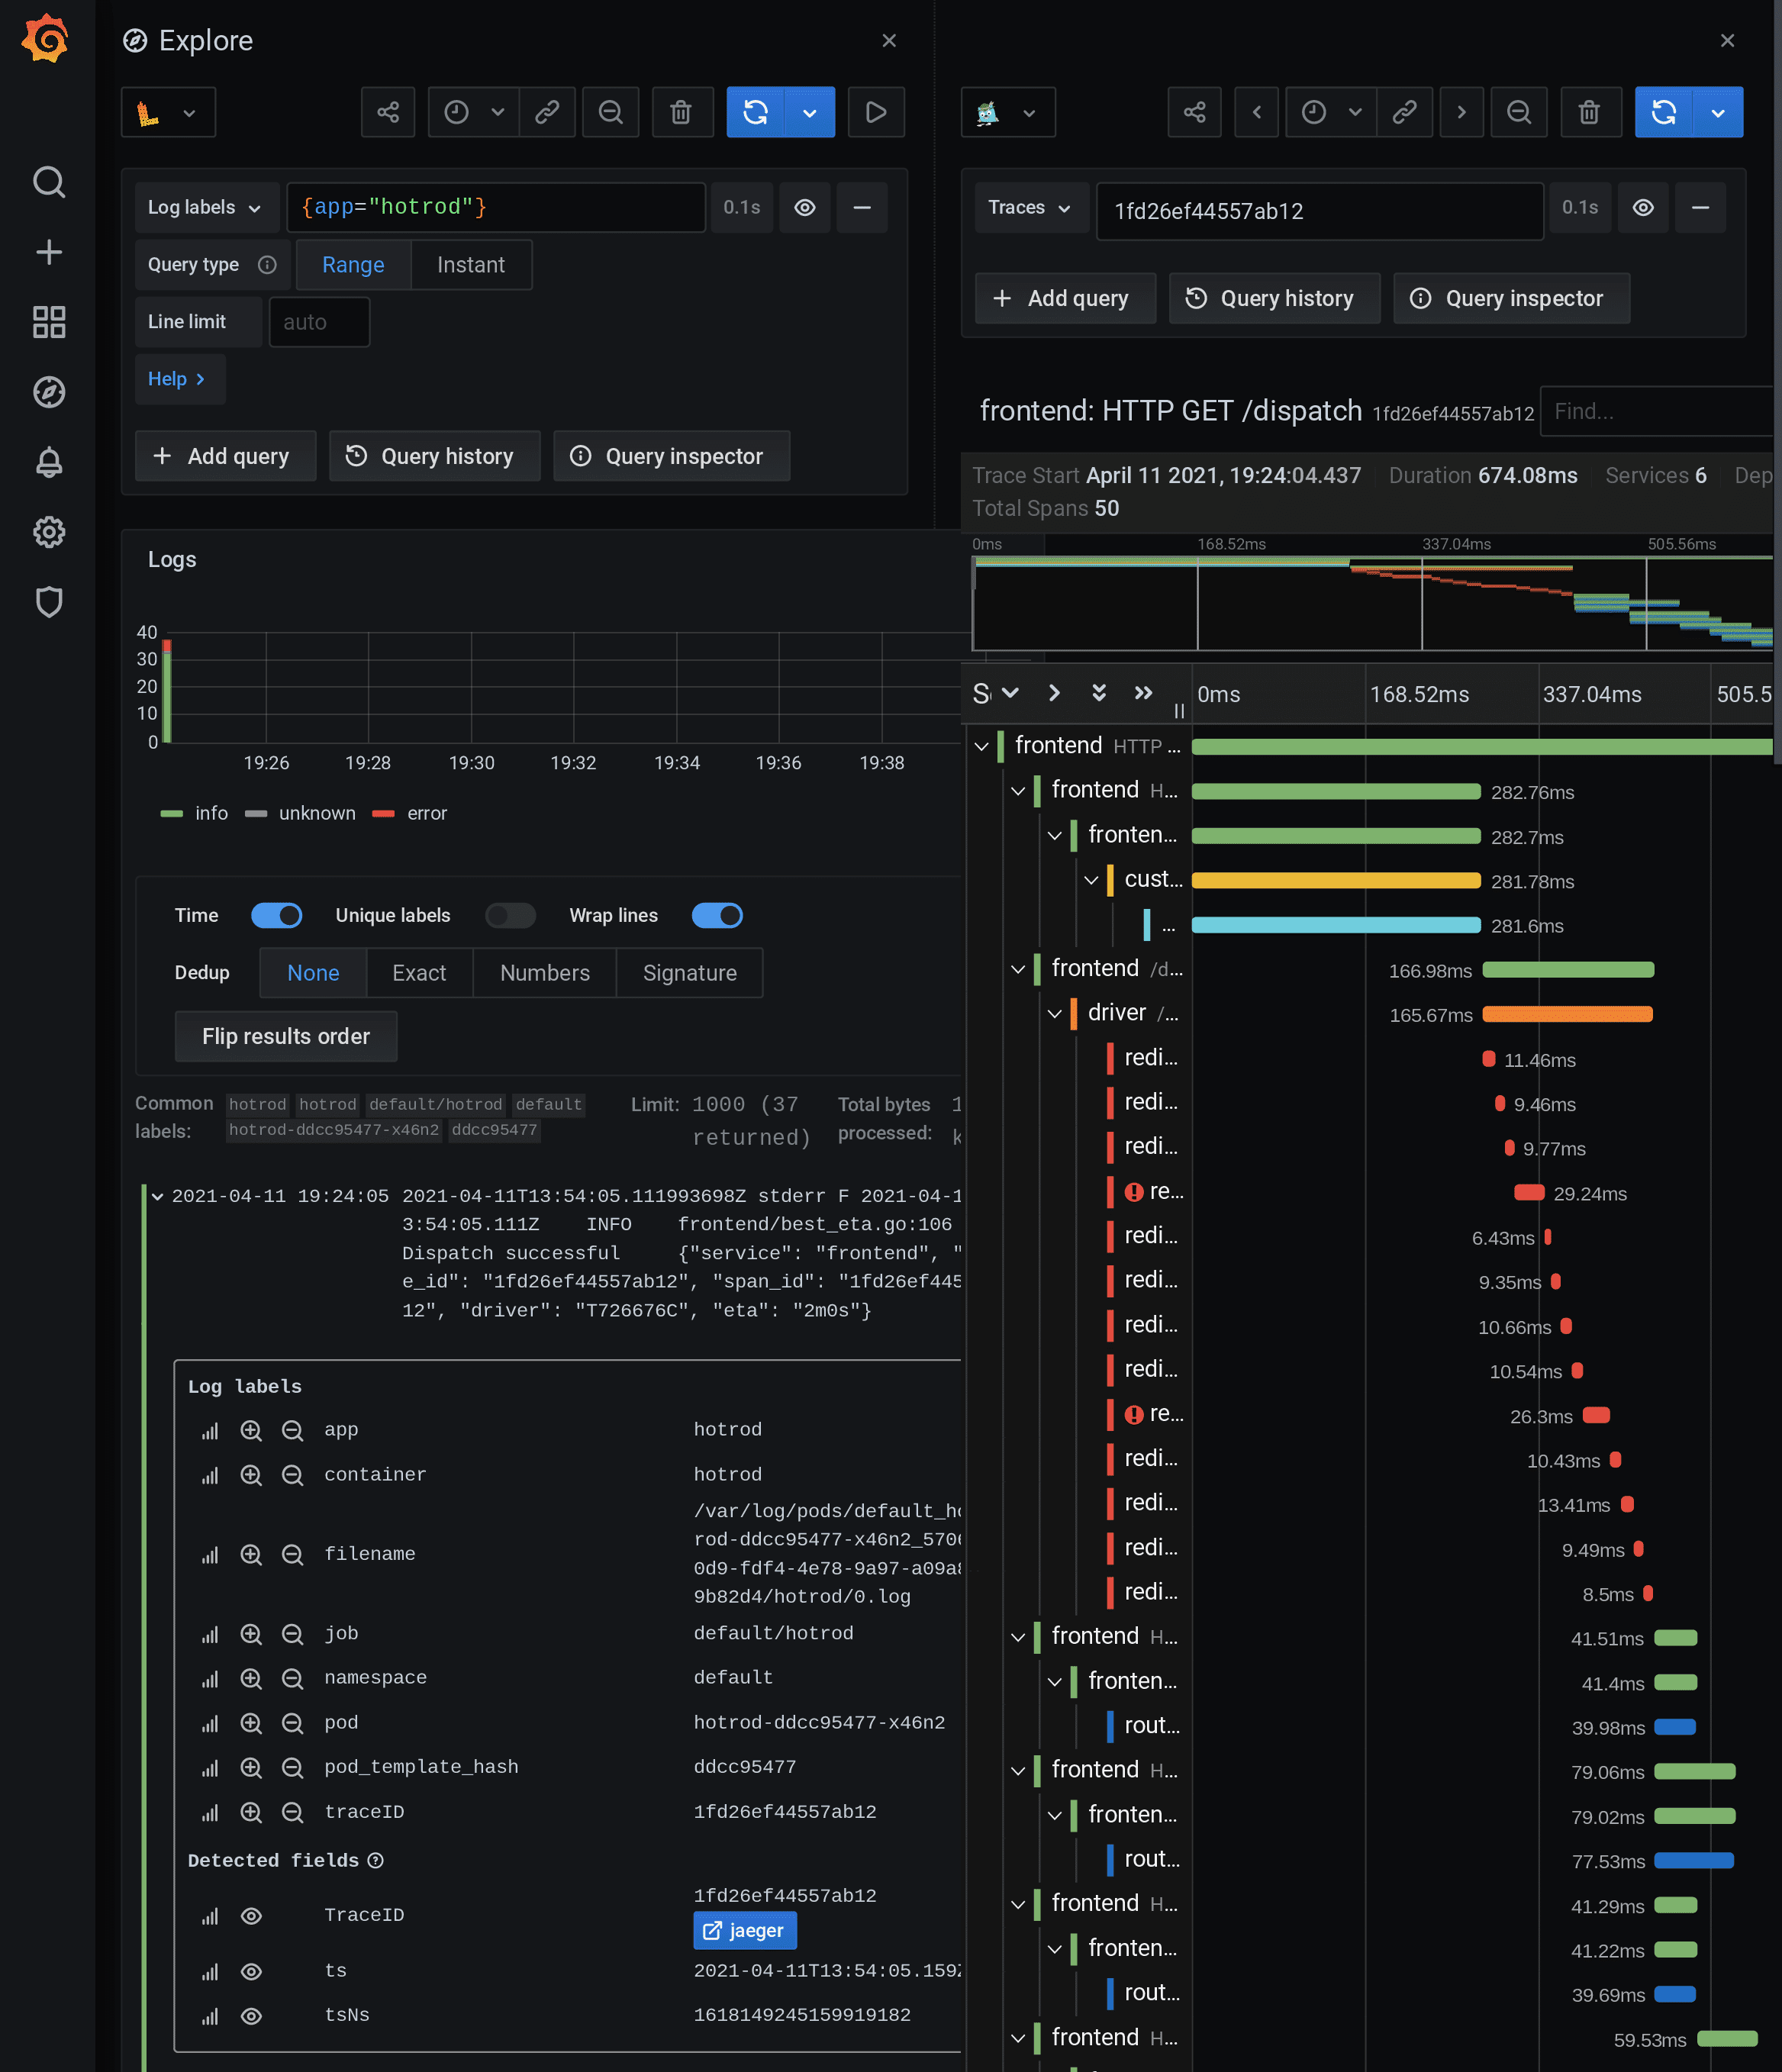
Go to explore, select loki as a data-source, and select Log labels as {app="hotrod"} to visualize the logs. You can see the span context containing info like trace and span id in JSON. Copy the trace id. Duplicate the window and go to explore, and select Jaeger as a data-source. Paste the trace id and run the query for visualizing all the traces of the request.

Configure Loki derived fields
This technique won’t be effective while analyzing burst requests. We need something that will be more efficient and easy to operate. For this, we will use the concept of Loki derived fields. Derived fields allow us to add a parsed field from the log message. We can add a URL comprising the value of the parsed field. Let’s see how this does the trick, but first, add the following config in the prom-oper-values.yaml:
- name: loki
  type: loki
  access: proxy
  orgId: 1
  url: http://loki:3100
  basicAuth: false
  isDefault: false
  version: 1
  editable: true
  jsonData:
    derivedFields:
    - datasourceUid: my-jaeger
      matcherRegex: ((\d+|[a-z]+)(\d+|[a-z]+)(\d+|[a-z]+)(\d+|[a-z]+)(\d+|[a-z]+)(\d+|[a-z]+)(\d+|[a-z]+)(\d+|[a-z]+)(\d+|[a-z]+)(\d+|[a-z]+)(\d+|[a-z]+))
      url: '$${__value.raw}'
      name: TraceID
Note that datasourceUid has the value of Jaeger’s uid. This will help identify the data-source while creating the internal link. matcherRegex has the regex pattern for parsing the trace id from the log message. URL comprises a full link if it points to an external source. If it’s an internal link, this value serves as a query for the target data source. $${__value.raw} macro interpolates the field’s value into the internal link.
Add new log labels using Promtail pipelines
We will add one more change for ease of operation. As you have seen earlier, there was no trace id label on the Loki log. To add a particular label, we will use pipelineStages to form a label out of log messages. Create a loki-stack-values.yaml file and add the following code to it.
promtail:
    serviceMonitor:
      enabled: true
      additionalLabels:
        app: prometheus-operator
        release: prometheus

    pipelineStages:
    - docker: {}
    - match:
        selector: '{app="hotrod"}'
        stages:
        - regex:
            expression: ".*(?P<trace>trace_id\"\\S)\\s\"(?P<traceID>[a-zA-Z\\d]+).*"
            traceID: traceID
        - labels:
            traceID:
Here pipelineStages is used to declare a pipeline to add trace id label. You can find more details of the pipeline parameters here. Now we will upgrade both kube-prometheus-stack and loki-stack Helm charts with updated values.
helm upgrade --install prometheus prometheus-community/kube-prometheus-stack --values=prom-oper-values.yaml
helm upgrade --install loki grafana/loki-stack --values=loki-stack-values.yaml
How to Visualize distributed tracing in Grafana using Jaeger and Tempo?
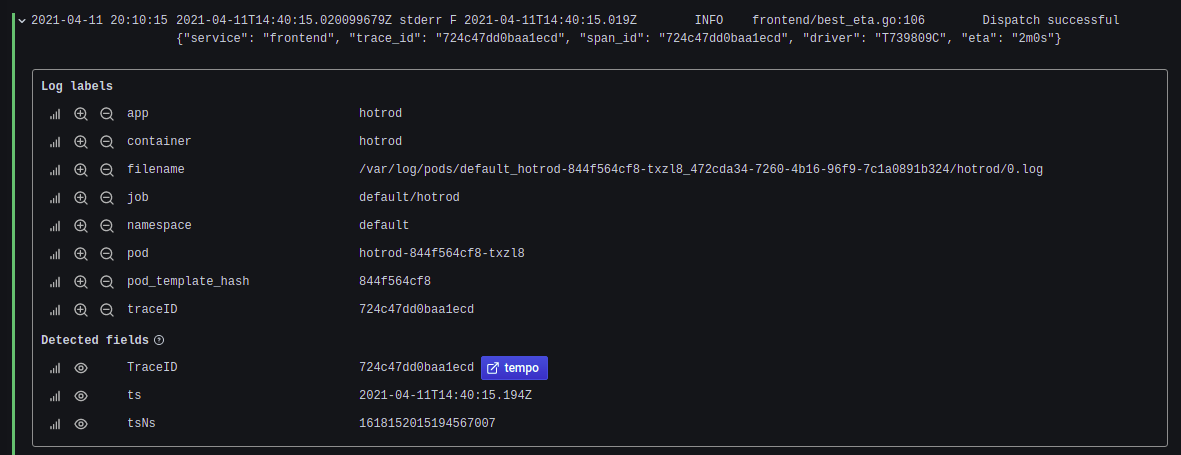
We will again visit HOTROD UI and trigger the request from there. In the Grafana dashboard, click explore and select loki as a data-source. Add {app="hotrod"} in Log labels. Now you will see a derived field with the name TraceID with an automatically generated internal link to Jaeger. You will also see an extra label with the name traceID. Click the derived field TraceID, and it will directly take you to Jaeger data-source and show all the traces of the particular trace id. This makes switching between logs and traces much easier. Also, this makes clear how to parse the log message according to the requirement.

Next, we will add Grafana Tempo as a data-source and visualize traces with minimal changes with the same setup. To enable this add the following lines in prom-oper-values.yaml and upgrade the Helm chart:
- name: tempo
  type: tempo
  uid: my-tempo
  access: browser
  url: http://tempo:16686
  isDefault: false
  version: 1
  editable: true
  basicAuth: false
Change the data-source uid in loki’s configuration to tempo’s uid (e.g. datasourceUid: my-tempo) in prom-oper-values.yaml. Tempo uses Jaeger client libraries to receive all the trace related information. So, we will delete the Jaeger deployment and its service. To install Tempo in a single binary mode, we will use the standard Helm chart provided by Grafana.
helm upgrade --install tempo grafana/tempo
We also need to change the JAEGER_AGENT_HOST variable in HOTROD (hotrod-deployment.yaml) to tempo for the correct identification of traces. Incorrect value or missing value may lead to the following error:

Re-apply the hotrod-deployment manifest to incorporate the changes made. Once again, visit the HOTROD UI and trigger the request from there. Now check for HOTROD logs in loki. You notice that the link in the derived field changes to Tempo. Click it and you can visualize all the trace information like before.

Conclusion
To summarize the post, we touched upon the following points:
- How to enable distributed tracing in a microservice application.
- How to convert a docker-compose manifest into Kubernetes manifest.
- How to enable Jaeger tracing in the deployment manifest of an application.
- How to configure Loki derived fields.
- How to parse log messages to add new labels using the Promtail pipeline concept.
- How to visualize distributed tracing in Grafana using Jaeger and Tempo data-sources.
We hope you found this blog informative and engaging. If you have questions related to tracing in Grafana with Tempo and Jaeger, feel free to reach out to me on Twitter or LinkedIn and start a conversation :)
Looking for help with observability stack implementation and consulting? do check out how we’re helping startups & enterprises as an observability consulting services provider.
References
Stay updated with latest in AI and Cloud Native tech
We hate 😖 spam as much as you do! You're in a safe company.
Only delivering solid AI & cloud native content.


