EdgeX Foundry on K3s - the Initiation

This blog post is part 2 of a series of articles about how to deploy and operate EdgeX Foundry - an open source software framework for IoT Edge on K3s - a lightweight, highly available, and secured orchestrator.
See the first part of this series:
In the first part of this series, we have seen all the pre-requisites that are needed to proceed with the hands-on. We will extend the EdgeX Foundry tutorial by Jonas Werner and deploy the EdgeX Foundry services on K3s. We have already learned that K3s will be a good lightweight solution to manage and orchestrate the EdgeX microservices. We will use the Geneva version of EdgeX Foundry.
The scope of this post is to demonstrate an Edge use case that will consume the sensor data e.g. ambient temperature. This sensor data will then be processed by EdgeXFoundry services hosted on K3s. This sensor data will be pushed to a cloud-based MQTT broker called HiveMQ. From here, the data can be stored and processed in the cloud. The configurations and manifests used in these posts are available in this repository.
Setup
The end-to-end setup looks like Fig.1.

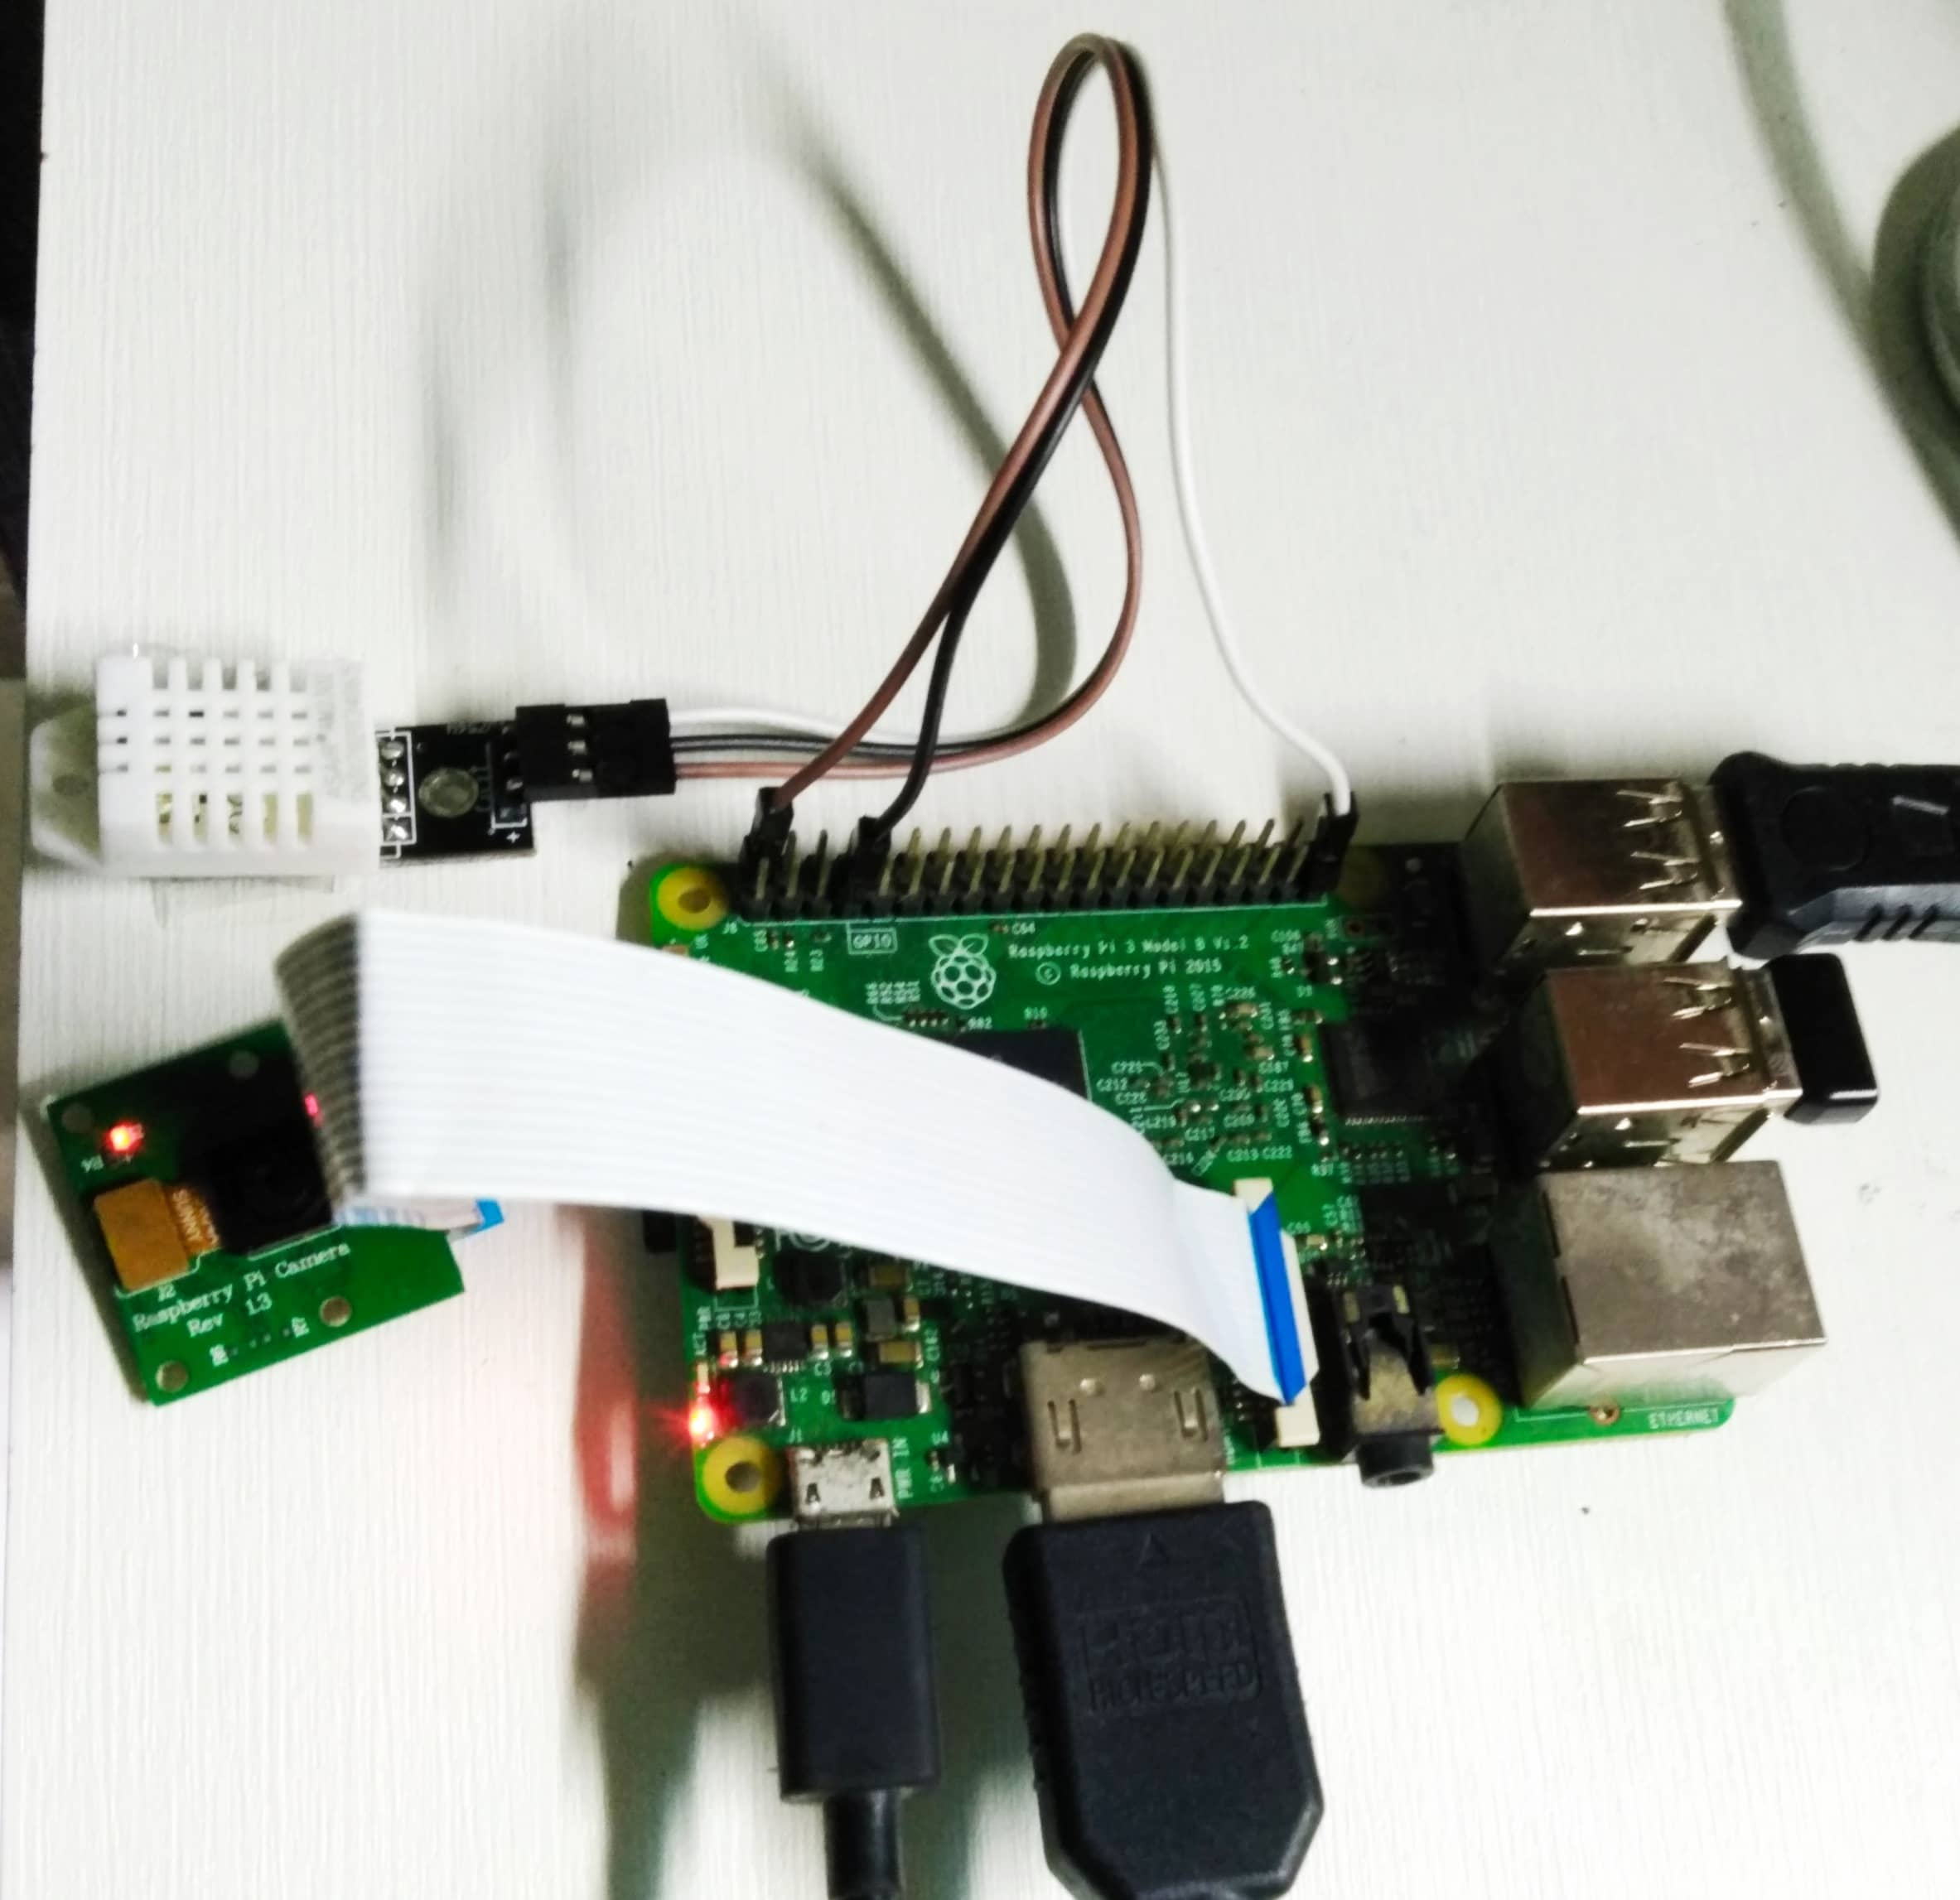
DHT-22 with Raspberry-Pi (Edge Device)
We will use a DHT-22 sensor that captures ambient temperature and humidity. Note that the sensor doesn’t require a breadboard or resistor, it is all mounted on the SMD (Surface Mounted Devices). DHT sensor will be connected to GPIO (General-purpose I/O) pins of Raspberry Pi.
The following changes are made in the script that captures temperature and sends the sensor data to the EdgeX. The EdgeX IP, DHT sensor type, GPIO pin of the Raspberry-Pi, and NodePort of edge-device-rest service as shown below.
import sys, time, requests, json, Adafruit_DHT

edgexip = "192.168.1.179"

while True:

    # Update to match DHT sensor type and GPIO pin
    rawHum, rawTmp = Adafruit_DHT.read_retry(22, 4)

    urlTemp = 'http://%s:32536/api/v1/resource/Temp_and_Humidity_sensor_cluster_01/temperature' % edgexip
    urlHum  = 'http://%s:32536/api/v1/resource/Temp_and_Humidity_sensor_cluster_01/humidity' % edgexip

How do you deploy EdgeX on K3s?
Let us first deploy a K3s cluster, with K3s-server and K3s-agent on two separate VMs as seen in Fig. 3. The EdgeX services on K3s will act more like a Gateway (see Fig. 4 in part-1). For the VMs, we will use Ubuntu-20.04 OS. Once the VMs are created, proceed with the following steps to deploy K3s. Note that, it will be better to configure static IPs on both VMs.
K3s server/master
To configure the K3s server, we will use the following steps
export K3s_NODE_NAME=${HOSTNAME//_/-}
export K3s_EXTERNAL_IP=<host-ip>
curl -sfL https://docs.rancher.cn/k3s/k3s-install.sh |  sh -
Copy the node token generated
cat /var/lib/rancher/k3s/server/node-token
Check whether the K3s server is up and running
systemctl status k3s
K3s agent
To configure the K3s agent, we will use the following steps
export K3S_TOKEN=<node-token of K3s server>
export K3s_URL=https://<ip of k3s server>:6443
export INSTALL_K3S_EXEC="--docker --token $K3S_TOKEN --server $K3S_URL"
export K3S_NODE_NAME=${HOSTNAME//_/-}
curl -sfL https://docs.rancher.cn/k3s/k3s-install.sh | sh -
Check whether the K3s server is up and running
systemctl status k3s-agent
Make sure you have installed cli tools like kubectl and helm. Also ensure that you have set correct permissions for the same. kubeconfig file for K3S is stored at /etc/rancher/k3s/k3s.yaml. Set the KUBECONFIG environment variable before proceeding further.
export KUBECONFIG=/etc/rancher/k3s/k3s.yaml
How to deploy EdgeX Foundry on K3s?
Once K3s is is up and running, clone this repository for deploying EdgeX Foundry.
git clone https://github.com/rutu-k/edgex-k3s.git
Note that, EdgeX Foundry has a docker-compose manifest to try and test its services. Using kompose we can convert the docker-compose manifest to Kubernetes manifest.
Also, after converting to Kubernetes manifest, the applications which were using volumes may not be configured properly and eventually won’t work in Kubernetes. For this reason, the respective manifests must be corrected properly. For simplicity, emptyDir volumes are configured.
First, we will start with Consul. Consul is used as a registry by EdgeX Foundry.
helm --kubeconfig /etc/rancher/k3s/k3s.yaml upgrade --install consul ./consul-helm
Once Consul is in running state, you can visit the dashboard http://[K3s server ip]:[NodePort of service]
Note that if you visit the Key-Value store, it will be empty. We need to provide the respective configs for the EdgeX Foundry services. For this, we will import the Key-Values and store it in Consul. I have exported the Key/Value JSON file from the Consul when I was going through the tutorial’s docker-compose deployment.
consul kv import --http-addr=http://[K3s server ip]@edgex-kv.json
Now you will see the configs in the Key-Value store.
Deploy the EdgeX Foundry application services
kubectl apply -f /k3s/.
Notice that all the application services are up and running.
$ kubectl get svc
NAME                                   TYPE        CLUSTER-IP      EXTERNAL-IP   PORT(S)                                                                   AGE
kubernetes                             ClusterIP   10.43.0.1       <none>        443/TCP                                                                   4d1h
edgex-redis                            ClusterIP   10.43.56.89     <none>        6379/TCP                                                                  3d23h
edgex-core-consul                      ClusterIP   None            <none>        8500/TCP,8301/TCP,8301/UDP,8302/TCP,8302/UDP,8300/TCP,8600/TCP,8600/UDP   25h
consul                                 NodePort    10.43.193.246   <none>        80:32688/TCP                                                              25h
edgex-app-service-configurable-mqtt    NodePort    10.43.102.126   <none>        48101:32294/TCP                                                           4h26m
edgex-app-service-configurable-rules   NodePort    10.43.138.76    <none>        48100:30136/TCP                                                           4h26m
edgex-core-command                     NodePort    10.43.52.70     <none>        48082:32400/TCP                                                           4h26m
edgex-device-rest                      NodePort    10.43.167.127   <none>        49986:32536/TCP                                                           4h26m
edgex-core-metadata                    NodePort    10.43.132.29    <none>        48081:30220/TCP                                                           4h26m
edgex-support-notifications            NodePort    10.43.39.183    <none>        48060:32680/TCP                                                           4h26m
edgex-kuiper                           NodePort    10.43.231.24    <none>        48075:30082/TCP,20498:31868/TCP                                           4h26m
edgex-support-scheduler                NodePort    10.43.6.49      <none>        48085:31497/TCP                                                           4h26m
edgex-sys-mgmt-agent                   NodePort    10.43.250.114   <none>        48090:31736/TCP                                                           4h25m
edgex-core-data                        NodePort    10.43.251.191   <none>        5563:32220/TCP,48080:31931/TCP
$ kubectl get pods
NAME                                                    READY   STATUS    RESTARTS   AGE
edgex-redis-54fb576f64-bdv9x                            1/1     Running   1          3d12h
consul-0                                                1/1     Running   0          25h
edgex-core-metadata-5bd45879cf-h9tbs                    1/1     Running   0          4h25m
edgex-kuiper-bbc6cf47-trkdl                             1/1     Running   0          4h25m
edgex-sys-mgmt-agent-7fb78c6fc5-qmqc2                   1/1     Running   0          4h25m
edgex-support-notifications-7b45446cbc-bqhvb            1/1     Running   0          4h25m
edgex-app-service-configurable-mqtt-59b5c7b6c8-8zhfc    1/1     Running   1          4h25m
edgex-app-service-configurable-rules-58c6846d54-s29hp   1/1     Running   1          4h25m
edgex-core-command-78b5ff9864-hb6wr                     1/1     Running   0          4h25m
edgex-core-data-86f5864db6-cvbl7                        1/1     Running   0          4h25m
edgex-support-scheduler-755b5779dc-br2d8                1/1     Running   0          4h25m
edgex-device-rest-599c579bf5-zbrg8                      1/1     Running   0          4h25m
EdgeX Foundry workflows
EdgeX workflow can be divided into three main parts namely; Device, Core Data Service, and Application Service. There is another part for actuation where an action can be taken by analyzing the sensor data, but this is out of scope for this post.
-
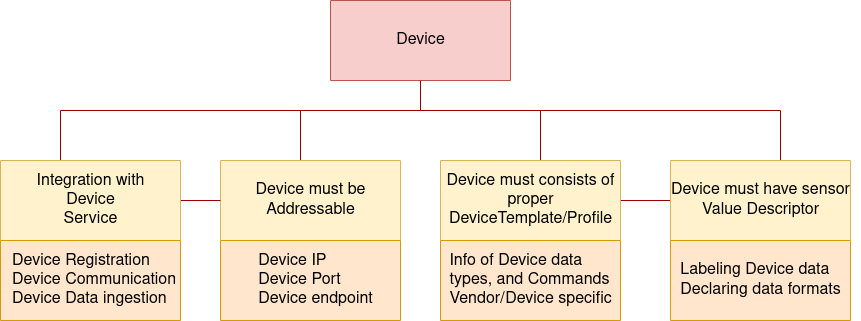
Device workflow: It is the process of adding a particular sensor device, its profile, selecting the proper device protocol, creating an event object, and sending it to Core Data Service. If you want to add any device to the EdgeX Foundry, it needs three configurations as shown in Fig. 3:

-
ValueDescriptor: Next, the device service needs to inform EdgeX about the type of data it will be sent on the behalf of the devices. If you are given the number 5, what does that mean to you? Nothing, without some context and unit of measure. For example, if I was to say 5 feet is the scan depth of the camera right now, you have a much better understanding of what the number 5 represents. In EdgeX, Value Descriptors provide the context and unit of measure for any data (or values) sent to and from a device. As the name implies, a Value Descriptor describes a value - it’s unit of measure, its minimum and maximum values (if there are any), the way to display the value when showing it on the screen, and more. Any data obtained from a device (we call this a GET from the device) or any data sent to the device for actuation (we call this SET or PUT to the device) requires a Value Descriptor to be associated with that data.
-
Device profile: The device profile describes a type of device within the EdgeX system. Each device managed by a device service has an association with a device profile, which defines that device type in terms of the operations which it supports.
-
Device definition: Device information like manufacturers, a protocol which it will use, device profile, etc.
-
-
CoreData Service Workflow: Data is submitted to core data as an
Eventobject. An event is a collection of sensor readings from a device (associated with a device by its ID or name) at a particular point in time. AReadingobject in anEventobject is a particular value sensed by the device and associated with a Value Descriptor in order to provide context to the reading. -
Application Service Workflow: Application Services are a means to get data from EdgeX Foundry to external systems and processes (be it analytics package, enterprise or on-prem application, cloud systems like Azure IoT, AWS IoT, or Google IoT Core, etc.). Application Services provide the means for data to be prepared (transformed, enriched, filtered, etc.) and groomed (formatted, compressed, encrypted, etc.) before being sent to an endpoint of choice. Endpoints supported out of the box today include HTTP and MQTT endpoints, but will include additional offerings in the future and could include custom endpoints.
Let’s see it in action
Trigger the script to activate the DHT sensor and send the temperature values to the EdgeX Foundry.
$ python rpiPutTempHum.py
Temp: 27.7999992371C, humidity: 77.5%
Temp: 28.2000007629C, humidity: 75.5999984741%
Temp: 28.1000003815C, humidity: 75.5%
Temp: 28.1000003815C, humidity: 75.4000015259%
Temp: 28.2000007629C, humidity: 75.3000030518%
Temp: 28.2000007629C, humidity: 75.3000030518%
Temp: 28.2000007629C, humidity: 75.3000030518%
As the sensor readings increase, the event count in the EdgeX Foundry also increases.
└─ $ ▶ curl http://192.168.1.179:31931/api/v1/event/count
2043
We can also get the latest temperature value.
└─ $ ▶ curl http://192.168.1.179:31931/api/v1/reading | json_pp -json_opt pretty,canonical | tail -n 10

  % Total    % Received % Xferd  Average Speed   Time    Time     Time  Current
                                 Dload  Upload   Total   Spent    Left  Speed
100  396k    0  396k    0     0  9660k      0 --:--:-- --:--:-- --:--:-- 9660k
   {
      "created" : 1632159295863,
      "device" : "Temp_and_Humidity_sensor_cluster_01",
      "id" : "ffcf2a3b-6ecc-4476-9ab6-e17ae983886f",
      "name" : "temperature",
      "origin" : 1632159295861600937,
      "value" : "28",
      "valueType" : "Int64"
   }
]
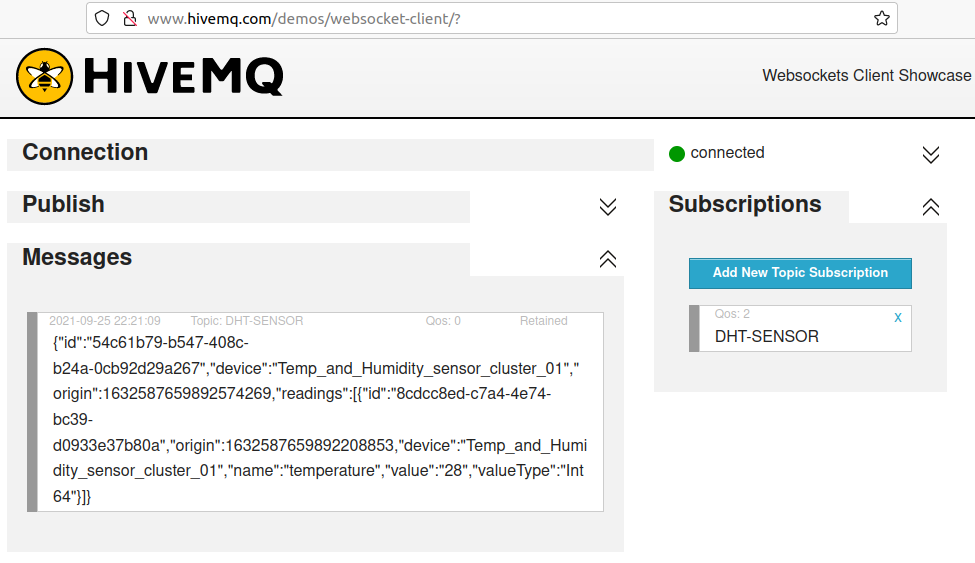
To have a demo of Application services, we will configure Application-Mqtt-service to send the temperature values to the MQTT broker. The edgex-app-service-configurable-mqtt service (check the deployed services in section ‘EdgeX Foundry on K3s’) is a community-provided exporter that sends EdgeX sensor data to the public MQTT broker hosted by HiveMQ at (http://broker.mqttdashboard.com) on port 1883. This sensor data can then be visualized via HiveMQ provided MQTT browser client by publishing and subscribing to a particular topic.
The topic name is configured in the env variables of edgex-app-service-configurable-mqtt deployment (refer here).
- name: WRITABLE_PIPELINE_FUNCTIONS_MQTTSEND_ADDRESSABLE_TOPIC
    value: DHT-SENSOR
Go to HiveMQ MQTT browser client. Click Connect with default configuration. Next, click on Add New Topic Subscription, type the topic name DHT-SENSOR and click on Subscribe. You will see the sensor data in Messages.

Conclusion
In this post, we have seen the following:
- How to deploy K3s?
- How to convert docker-compose manifest to Kubernetes manifest?
- How to deploy EdgeX Foundry on K3s?
- How to send sensor data from Raspberry Pi to EdgeX Foundry?
So far, we have seen how to process the data that is received from the sensors. We can also take pre-defined actions by further analyzing the data. EdgeX Foundry provides support for Edge analytics by incorporating eKuiper rules engine. We will try to cover it in the next part.
I hope you found this post informative and engaging. For more posts like this one, do subscribe to our weekly newsletter. I’d love to hear your thoughts on this post, so do start a conversation on Twitter or LinkedIn :).
Looking for help with your cloud native journey? do check out how we’re helping startups & enterprises with our cloud native consulting services and capabilities to achieve the cloud native transformation.
References and further reading
Stay updated with latest in AI and Cloud Native tech
We hate 😖 spam as much as you do! You're in a safe company.
Only delivering solid AI & cloud native content.


